
+
- 07-02-2022
- Grégoire Bideau
Recherche
Audiovisuel
Recherche
Audiovisuel
A method for measuring content prominence on Netflix
Detailed walkthrough of a novel method using single-board computers to simulate human interaction, permitting ceteris paribus analysis of prominence strategies.
At the Chaire PcEn, we have placed content prominence at the heart of our research program on cultural diversity. Whereas traditional approaches to measuring cultural diversity involved a fixed and limited number of works, we adopt the view that streaming services today give access to such a large selection of contents that those established methods are no longer relevant. Indeed, what is the use of measuring diversity in a catalogue that no one user ever sees in its entirety? Surely the more relevant space within which to study cultural diversity is the user’s screen and the subset of works from the catalogue that appear on it.
The present document outlines a new method for measuring content prominence on Netflix in a controlled environment. Using bots to mimic human behaviour on the platform, the researcher retains total control over what information is sent to the service and is able to automatically retrieve data pertaining to individual contents’ placement on the service.
Context
Studies that look at the make-up of streaming services’ catalogues are commonplace, and researchers tend to draw conclusions about these services’ content strategies based on the availability or unavailability of certain works. While this approach does have its merits (bird’s eye view of a content offer, insight into an acquisitions strategy...), it also overlooks a crucial aspect of non-linear content offers: the salience of some types of contents over others on the user’s screen.
Prominence on a linear television schedule is governed only by time; the most prominent programs are those that are broadcast during peak-audience time slots. However, in a non-linear context, prominence becomes a multi-faceted concept. Prominence in space simply corresponds to the position of each title on the page, the most prominent being those placed in the most noticeable spots. If we want to identify the most prominent titles over a period of time, then we must look at the length of time each title has stayed in a prominent area. Finally, in the case of personalised VoD services such as Netflix or Amazon Prime Video, prominent titles can vary based on each user’s past behaviour. This means that prominence on those services can only be inferred on a per-user basis.
In short, prominence as understood in a linear television context answers only to the question “when?”, whereas non-linear prominence is concerned with “where?”, “when?” and “for whom?”.
Summary explanation
For small-scale observations (one or few users during a short period of time), it is possible to keep a manual log of the prominent contents that appear on-screen. However, large-scale analyses require some form of automation in the data collection process. What’s more, VoD services typically do not give access to that kind of data, if any at all.
Our method for measuring content prominence involves computer- simulated web browsing. We use a script library called Watir for the Ruby programming language, which enables us to automate the browsing process by scheduling interactions with the browser (clicking on a button, scrolling a page etc.) and thus simulate human behaviour. When applied to a VoD service interface, automated browsing can be used to plan viewing sessions by scheduling login and logout times and selecting what content is to be “watched” and for how long. In essence, a Watir script browsing Netflix is a pre-programmed bot.
Theoretically-speaking, any number of bots can be created and run simultaneously, and each bot can be assigned a specific viewing schedule. We can also instruct each bot to store any relevant data, such as the contents of the homepage, in a shared database.
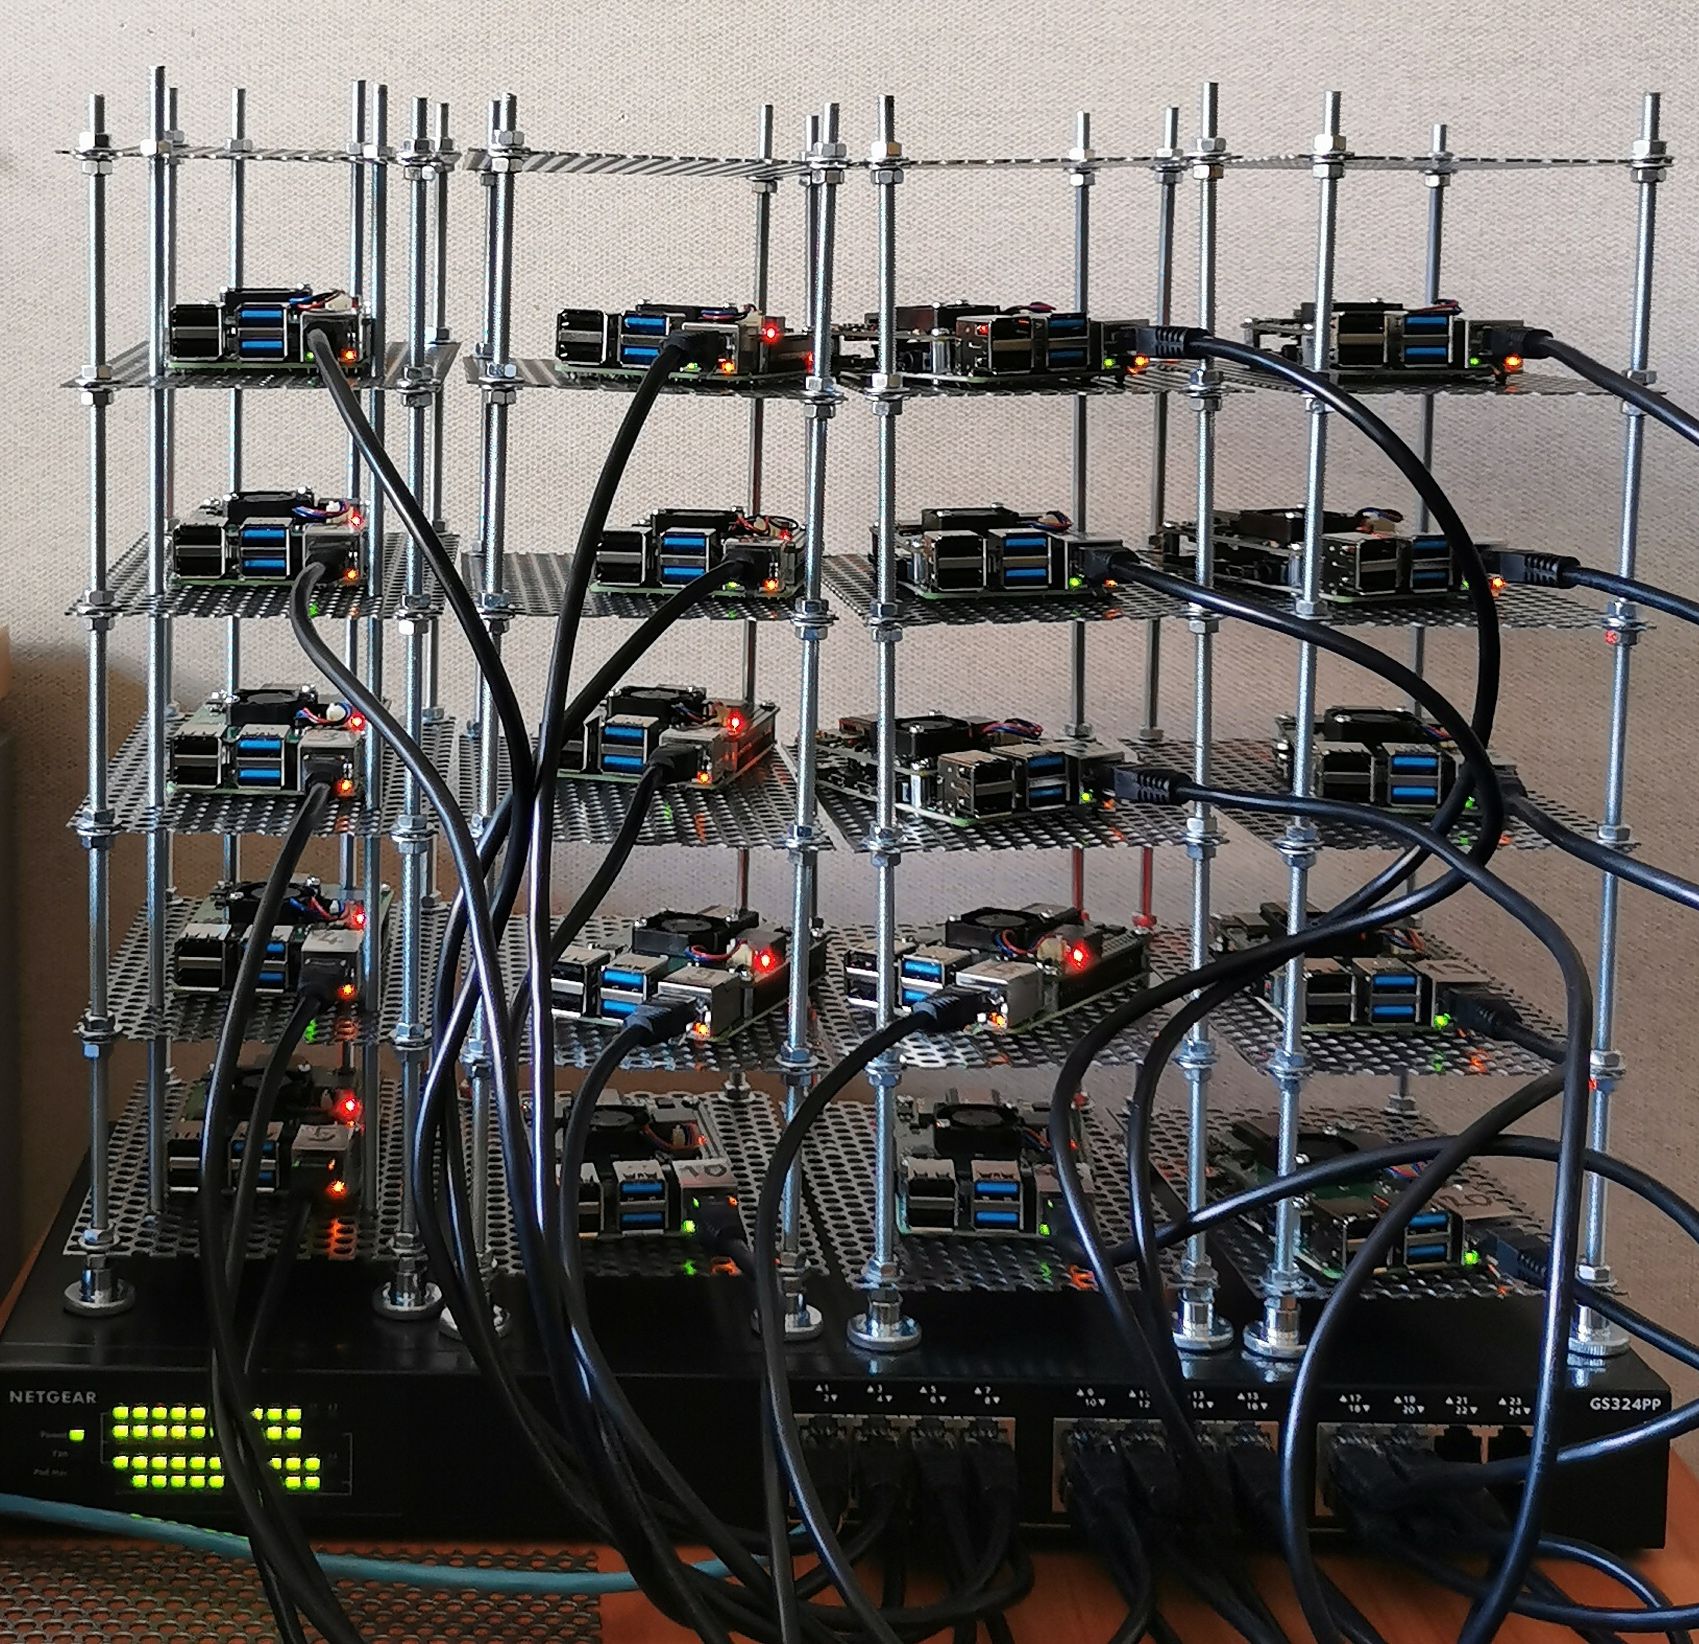
In order to implement this method on a scale where enough observations can be made, we rely on a custom-built cluster of Raspberry Pi Model 4B units.1 A Raspberry Pi is a small and compact single-board computer that is ideal for completing simple, repetitive tasks. Each "Pi" is responsible for executing the commands of a single bot.
In practice, we use our Pi cluster to test certain hypotheses. For example, if we were to test the hypothesis that European content is prominently placed on the Netflix homepage, we could instruct 10 of our bots to watch European contents for 3 hours daily over a week, and another 10 of our bots to watch non-European contents at the same rate. Each day, we would collect the homepage from every bot’s Netflix profile and insert it into a shared database. When the experiment is over, we can compare the make-up of every homepage, right down to the placement of every single title, and observe the prominence of European contents, all other things being equal. Thus being able to control every aspect of a bot’s behaviour on the platform is crucial to answering precise research questions that require ceteris paribus conditions.
Technical explanation
The following is a more in-depth walkthrough of our methodology and of the technologies it relies on.
Pi cluster
Our cluster of 20 Raspberry Pi’s is powered via a PoE+ (power over ethernet) ethernet switch that provides both power and an internet connection to each device. The Pi’s are fitted with a PoE+ hat enabling them to be powered via an ethernet cable. An SD card on each Pi is configured with a custom version of Raspberry Pi OS with specific settings (language, timezone etc.), pre-installed code libraries (Ruby, Watir etc.) and unique credentials (device name and ID, Netflix account and IoT hub credentials). On boot, a systemd service automatically executes a series of commands: pull the latest version of our code from our GitHub repo and run a Ruby script that connects to our Scaleway-hosted MQTT broker and awaits further instructions.
MQTT and MQTT broker
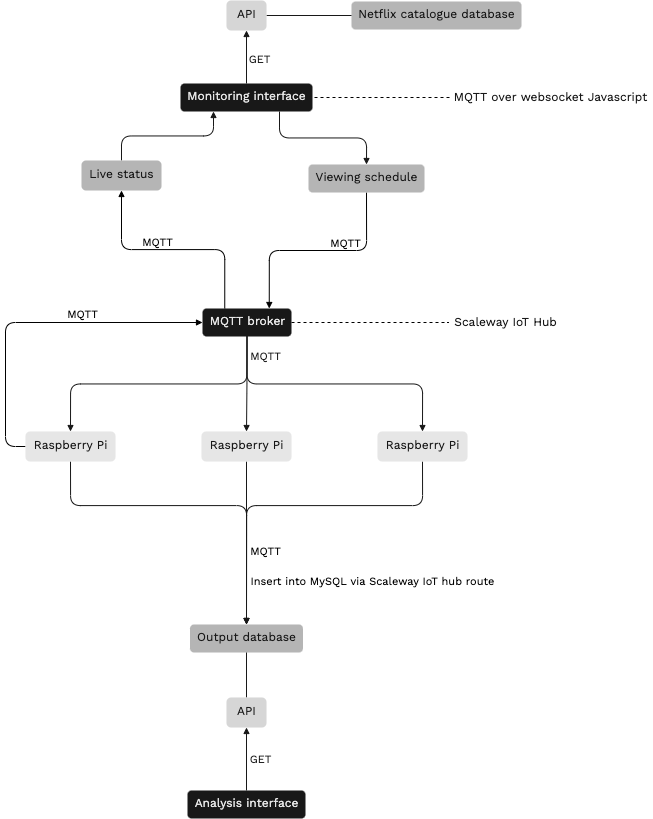
Our Raspberry Pi’s are at the heart of the system, as they execute the main function of our setup: browsing Netflix and "watching" content on the service. However, communication to and from the Pi’s is also crucial. They need to be told exactly how to behave and where to store data. For this, we rely on an IoT (Internet of Things) messaging protocol called MQTT. The MQTT protocol allows us to quickly send messages as packets of data to and from the Pi’s. All messages pass through an MQTT broker that acts as a post office, directing each published message to its intended recipient. We use a cloud-hosted MQTT broker provided by our partner Scaleway, which allows us to publish and receive messages from anywhere.2 What’s more, this cloud-hosted MQTT broker makes it possible for us to communicate with our Pi’s from a webpage, which brings us to our next essential component: the monitoring interface.
Monitoring interface
We built a web-based monitoring interface from scratch to act as a kind of control tower from which we can oversee our whole fleet of Pi’s. Using Javascript’s "MQTT over websockets" capabilities, we can connect our webpage to our MQTT broker and use it to control and monitor all devices.
With the MQTT protocol, information is transferred on topics, to which a device can subscribe and publish on. In our case, each device subscribes to its relevant MQTT topics and, in turn, each section of our monitoring interface publishes and receives messages on those same topics.
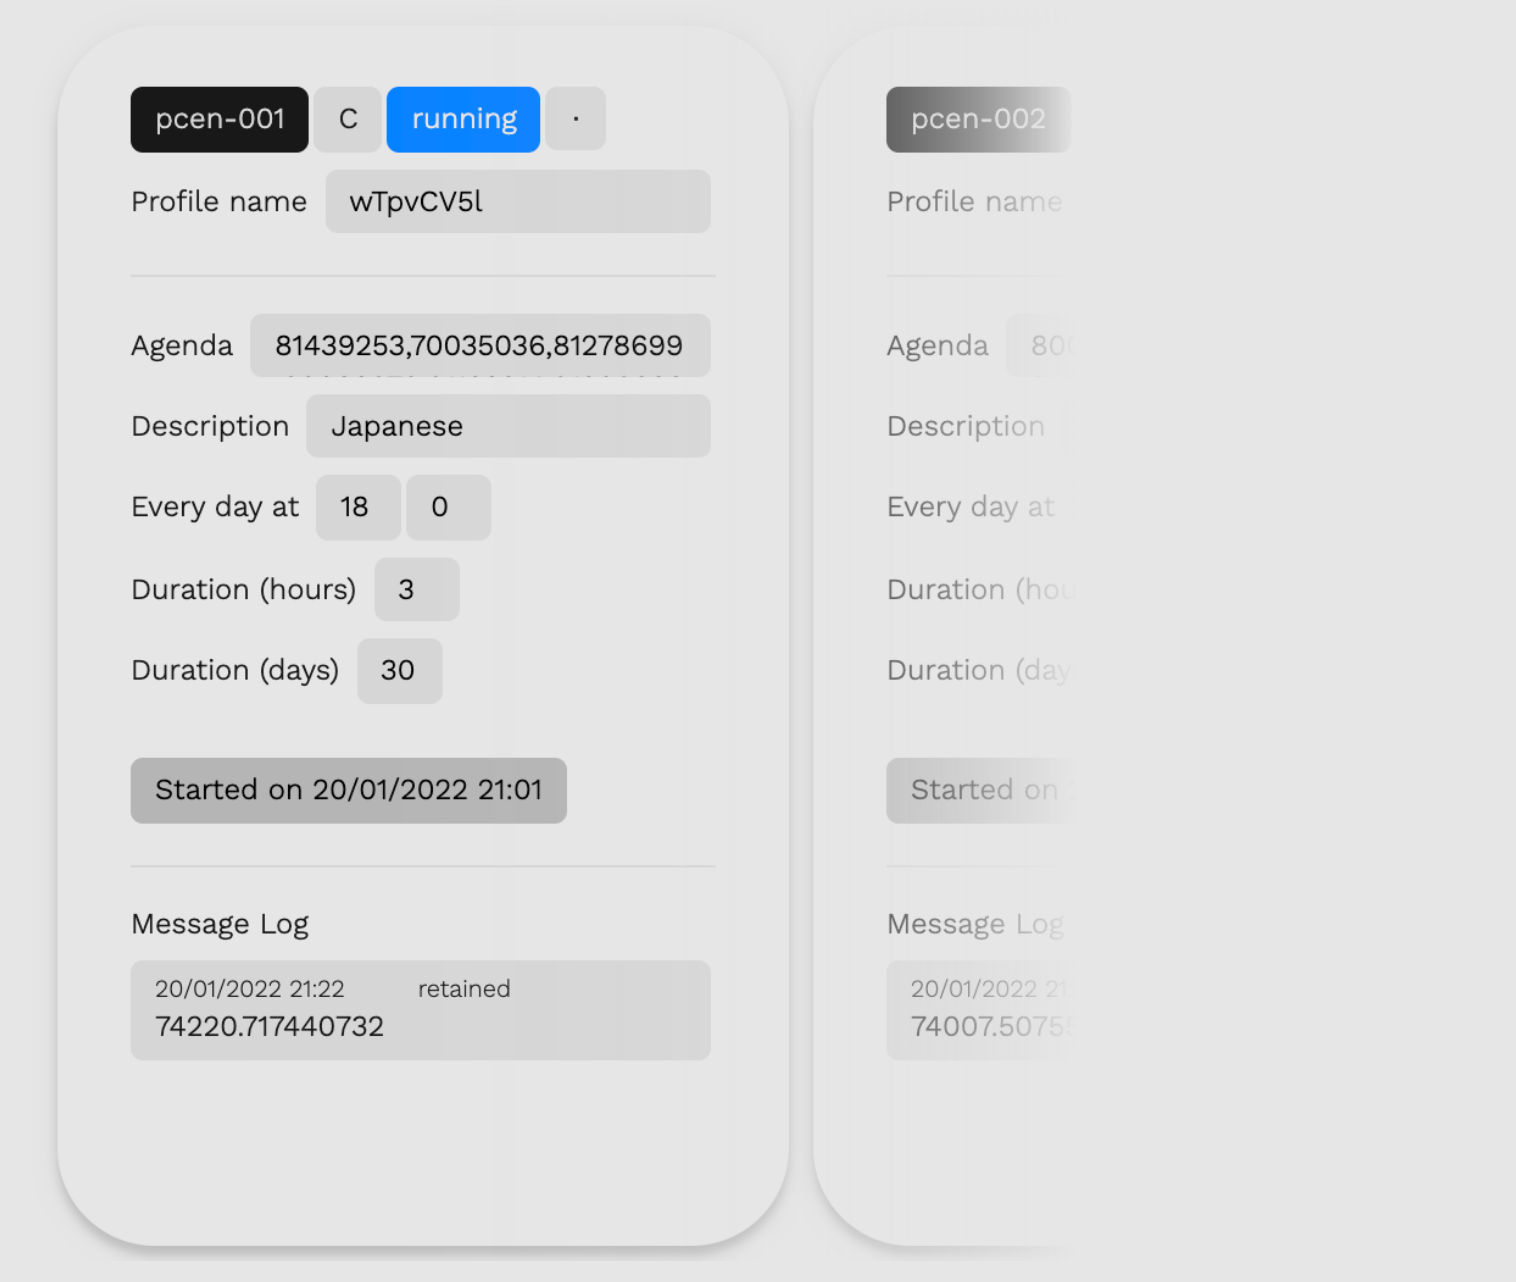
Upon opening the webpage, a connection is established with the MQTT broker. Each Pi has its own dedicated section on the page, on which live information pertaining to its status, schedule and viewing sessions is displayed. Effectively, the monitoring interface reads and publishes MQTT messages on a variety of topics for each device: 'status', 'schedule', 'sessions', 'homepages', 'watched contents'...
The flow of data
1. Content database
Our starting point is a MySQL database containing the entirety of the Netflix catalogue in France, along with associated metadata sourced from IMDb. This database is the result of monthly parsings from the platform itself. Each title is matched with its corresponding page on IMDb using a custom-built algorithm.
2. Scheduling
In order to obtain a list of titles that a bot will be assigned to watch, we query the database specifying our intended filters. For example, we can pull out a list of horror series produced between 2000 and 2010. We then paste this list into the 'Agenda' box of a device’s section on the monitoring webpage. Additional options allow us to set the frequency and duration of the bot’s viewing sessions. Finally, hitting the 'Send schedule' button triggers the publishing of several MQTT messages containing the schedule as specified above, which the device receives, "unpacks" and integrates into its script. Once the schedule is received, a 'Start' button appears which, when pressed, sends an MQTT message to the device telling it to start the experiment.
3. On the Pi’s
The script on each Pi is written in the Ruby programming language, and uses several Ruby gems: 'Watir Webdriver' to automate the browsing process, 'Rufus scheduler' to schedule tasks, and the ‘MQTT’ gem to establish a connection to our MQTT broker and thus enable our code to publish and read MQTT messages. At the start of the experiment, each Pi is instructed to create a new profile on its Netflix account and immediately parse the homepage. This is, in a way, a "virgin" homepage because the recommender system does not yet know the user’s preferences. Once this first homepage parsing is complete, the script pauses while it waits for its first scheduled viewing session.
Thanks to the Widevine DRM library available since March 2021 on the Raspberry Pi, our Chromium browser can play DRM-protected videos such as those on Netflix. On top of that, the videos can be played in headless mode, meaning that no screen is actually needed.
Each viewing session has a fixed duration and is followed by a homepage parsing. The next day, each bot simply continues to watch content starting from where it left off the day before.
4. Output database
At the end of each homepage parsing, the data is sent via MQTT, in JSON format, to the broker. When the broker receives a message on the ‘homepages’ topic, a Scaleway IoT Hub route is triggered. An IoT Hub route forwards an MQTT message from the broker to a specified destination. Here, the destination is a MySQL database. In the process, a stored procedure consisting of a number of MySQL queries distribute the contents of the received JSON file to the various tables in the database, while establishing relational connections between them. This "output database" is built in such a way that homepages can be easily reconstructed and compared during analysis.
All the while, regular status updates are sent from the Pi’s to the MQTT broker and displayed on the web-hosted monitoring interface.
Analysis interface
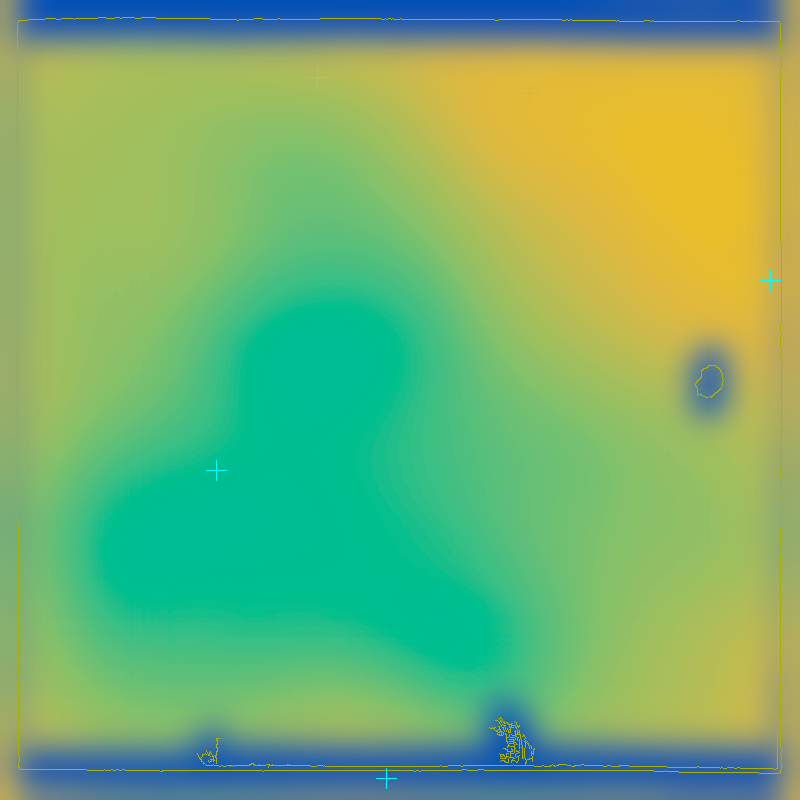
Once our experiment is over and the data is stored in the output database, we can begin to assess whether our starting hypothesis is confirmed. For this, we can simply run MySQL queries directly on our output database. However, this method can be counterproductive for two reasons. First, the sheer volume of data (one homepage a day for 20 profiles over 10 days amounts to 200 homepages, each with approximately 1400 thumbnails) means that it is difficult to get a sense of the "big picture". Second, our output data is inherently visual, as it reflects the visual hierarchy of each homepage that we parsed. Conducting analysis on data pertaining to the visual characteristics of the user interface without some kind of visual representation can indeed be arduous.
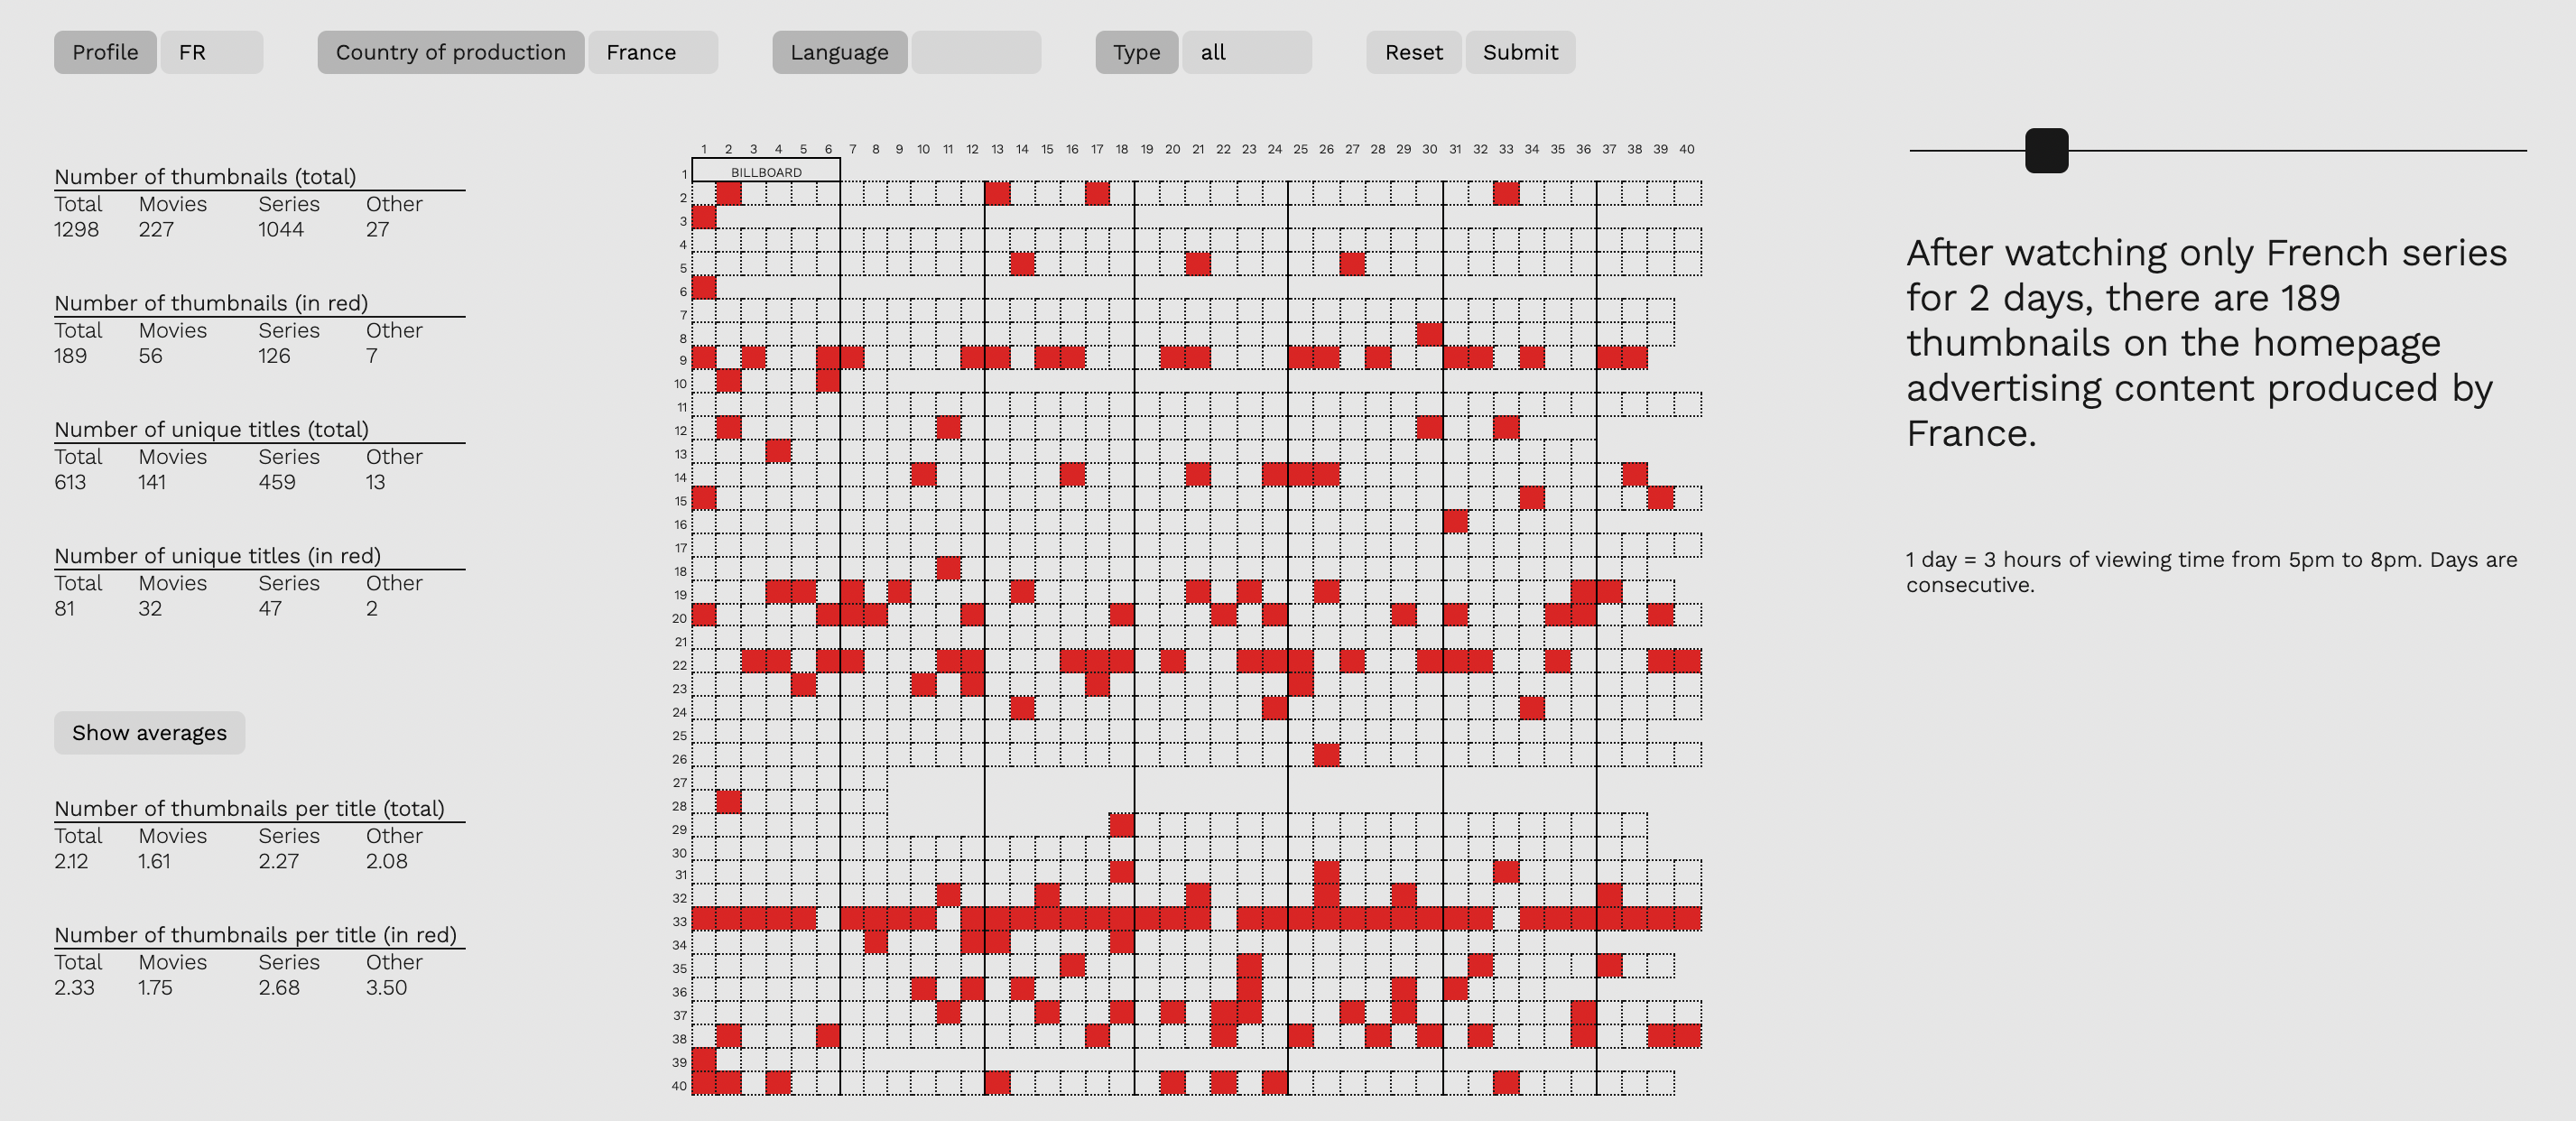
This is why we set about building an analytical UI that would allow us to quickly visualise the composition of each homepage. Based on a 40×40 grid representing the entirety of the columns and rows of a typical Netflix homepage, the interface also displays several key metrics, such as the total number of unique titles, the shares of films and series etc. A collection of filters means we can highlight the contents of our choosing on any homepage, and track their presence across several days with the aid of a slider.
Applicability to other services
Looking beyond our experimental setup’s focus on Netflix, its applicability to other services is achievable with only limited effort. The technologies and processes that form the backbone of our methodology on Netflix can be reused, while parts of the monitoring interface, the scripts on each Pi and the output database would have to be reworked. Overall, the structure of the experiment would remain the same. Hence in theory, content prominence strategies can also be studied in various industries, such as music (Spotify, Apple Music...), video (YouTube, TikTok...), gaming or live streaming (Twitch).
Notes
- ↑
There are two obstacles to conducting our experiment on the cloud using virtual machines instead of our own physical devices. The first is Netflix blocking IP addresses connected to data centres and the second is expense-related, as renting 20 server instances equipped with graphics cards would in the long run become far more costly than building our own cluster.
- ↑
For more info, see: scaleway.com/ en/iot-hub/